Home > Software > Scientific > Statistics > LabPlot

Details
- Package ID
- labplot
- Version
- 2.12.1
- Downloads
- 4420
- Website
- https://labplot.kde.org/
Summary
Scientific plotting and data analysis.
Description
LabPlot is a KDE-application for interactive graphing and analysis of scientific data. LabPlot provides an easy way to create, manage and edit plots and to perform data analysis.
Visit LabPlot Homepage for more details.
If you’re interested in following the development of the project or would like to contribute, visit https://labplot.kde.org/contribute/.
Features
Screenshots
Signal Processing
Fourier filter: A time signal containing Morse code is Fourier transformed to frequency space to see the main component. By applying a narrow band pass filter the Morse signal is extracted and a nice ‘SOS’ can be seen:

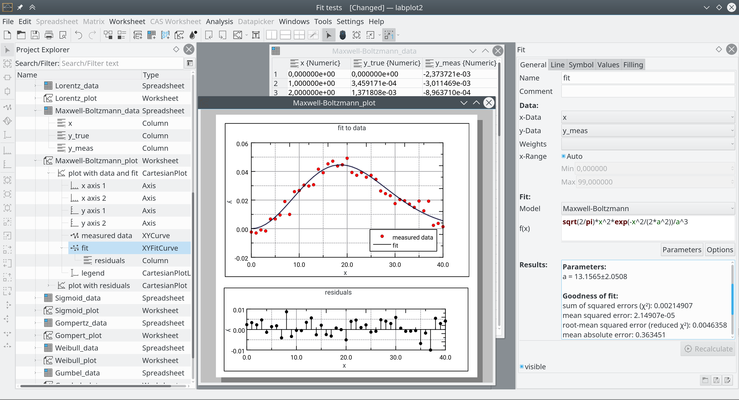
Main window of LabPlot showing the application in action
Plotting of mathematical functions

LabPlot provides support for open-source computer algebra systems and scientific languages like Maxima, Octave, R, etc. and allows to plot the data calculated in these systems/languages:

For more screenshots, see the gallery.